
2022 Norms for the COPSystem VIA Assessments

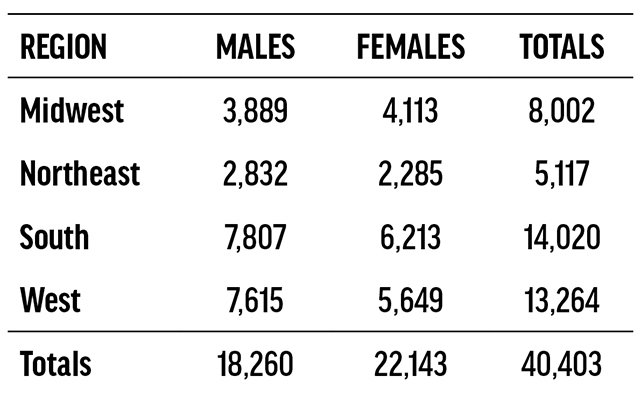
Norms for the COPSystem VIA are based on data gathered from 2019 through 2022 for a sample of individuals with education levels spanning from grade seven through college. This national sample was aggregated based on a population of subjects from four geographic regions of the U.S. identified by the 2020 U.S. Census Report. The average age of the sample was 30 years. Table 1 presents a summary of the sample sizes from each region by gender. These groupings were used to explore possible mean differences in vocational interests, values, and abilities as a function of where these individuals live and attend school.
Table 1 — Summary of COPS Normative Data by Region and Gender
Consistent with previous normative analyses, comparisons were made across gender, grade level, and region to explore which of these factors, if any, revealed mean differences of importance. Of these factors, only gender revealed consistent significant mean differences. Even so, these differences were only practically significant for the Technology, Skilled and Service, Professional scales. This suggests that scale means for males and females should be interpreted differently, as has been done in the past. Thus, all four regions were aggregated at the national level and two normative distributions, one for each gender, were determined through educational levels 7 through postgraduate.
Similar analyses were conducted on the COPES values and CAPS ability inventories. As in previous years, separate normative distributions were produced only when mean differences were observed that strongly and significantly influenced the interpretation of scores. In both cases, grade level was the only factor that revealed significant mean differences. Regional breakdowns were included in these tables to illustrate the breadth of test implementation across the country.
Normative analyses of the CAPS ability battery revealed mean differences as a function of grade level. The student profiles reflect this trend, splitting into three discrete groups: grades 7 through 9, grades 10 through 12, and high school graduates through doctoral graduates. Table 2 presents a summary of the sample sizes for each of these categories by region.
Table 2 — Summary of CAPS Normative Data by Region and Educational Level

Normative analyses of the COPES values inventory did not show mean differences as a function of either grade level or gender. Table 3 illustrates a summary of the sample sizes for both categories by region.
Table 3 — Summary of COPES Normative Data by Region

International analyses were also conducted. Our Canadian sample (n = 6,718) did not statistically differ from the American sample across the three COPSystem assessments. After analysis of the Spanish-language version of each assessment, it was determined that the Spanish COPS (n = 177) and COPES (n = 179) needed more data to justify separate norming. The Spanish CAPS (n = 379), however, was re-normed.
The multiple profiles discussed here have been developed using best practices methodology. Our goal throughout this process has been to increase the overall meaningfulness and effectiveness of the recommendations made by those who rely on the COPS, CAPS, and COPES inventories to assist them as they guide and influence examinees during their career exploration process.
For additional information, please email us at service@edits.net.
Learn more about the career clusters measured by the COPSystem.